|
|
|||||||||||||||||||||||||||||||||||||||||||||||||||||||||||||||||
|
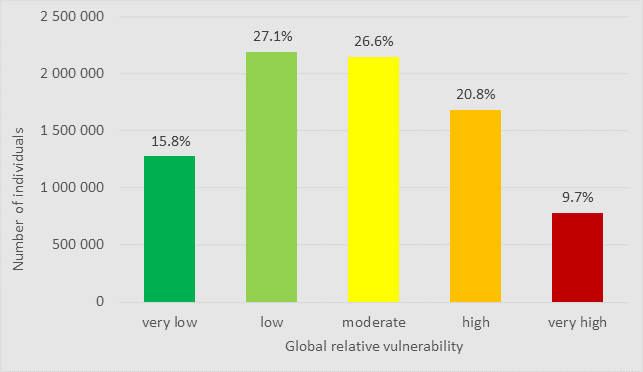
Number and proportion of individuals living in Québec by level of global vulnerability (2016 Census) More figures showing the population distribution by vulnerability type and level are included in the documentation.
|
|||||||||||||||||||||||||||||||||||||||||||||||||||||||||||||||||
IntroductionThe COVID-19 Vulnerability Index for Quebec (SVIQ) was developed with the goal of providing a tool to monitor biological, social, and environmental vulnerabilities related to the COVID-19 pandemic at the local level. It was inspired by the COVID-19 Community Vulnerability Index (CCVI) (Smittenaar et al., 2021) which was modelled after the Social Vulnerability Index (SVI) created by the Centers for Disease Control (CDC Agency for Toxic Substances and Disease Registry (ATSDR), 2020; Flanagan et al., 2011, 2018). Individuals share exposure at the neighbourhood level. In the absence of information on individual characteristics, area-based measures posit social homogeneity at the small-area level. Neighbourhoods and housing blocks are considered small-area geographic level. When we call a neighbourhood a ‘working class’ or ‘student’ neighbourhood, we refer to a predominant population characteristic that we attribute to all residents of the neighbourhood. An individual living in that neighbourhood may well be retired but the neighbourhood itself will be considered a ‘student’ neighbourhood if this group is the majority. Aggregated data attributed to all individuals in small geographic areas (neighbourhoods and housing blocks) are useful when individual-level data are unavailable and information needs to be imputed. The Canadian Census disseminates information from all residents in the country at the dissemination area (DA) level. This is considered to be a local geographic area as only approximately 600-800 individuals live in a DA. The SVIQ is useful for comparing levels and domains of vulnerability at the small-area level in the province of Quebec, within its sociosanitary regions and large municipalities (Montréal, Québec, Laval, Gatineau) and across rural, intermediate, and urban areas. Domains cover risk factors related to biological susceptibility, sociocultural and socioeconomic characteristics as well as environmental exposure. The index constitutes a multifunctional tool that can support efforts to understand vulnerability and manage issues related to vulnerability by various actors: · It can guide the planning and decision-making process of public authorities by contributing to the detection, anticipation, and monitoring of “hot spots” (high burden) of vulnerable populations living in specific geographic areas. · It can be used to monitor the evolution of the pandemic and other health issues in populations groups with varying levels of vulnerability. · It can be used to compare the effect of interventions between populations groups with varying levels of vulnerability, by vulnerability domain, regionally and across the province. · It is likely to support social interventions by making it possible to determine highly vulnerable communities and to adapt these interventions according to the targeted domain of vulnerability, to prevent or mitigate negative impacts as well as to promote protective factors. · It facilitates the study of health inequalities and inequities linked to biological, social and environmental vulnerability.
|
|||||||||||||||||||||||||||||||||||||||||||||||||||||||||||||||||
|
|
|||||||||||||||||||||||||||||||||||||||||||||||||||||||||||||||||
Defining vulnerabilityThe concept of social vulnerability within a disaster management context centers on risk factors that affect humans and community resilience adding depth to traditional risk assessment of threats to the built environment (Flanagan et al., 2018). In this perspective, social vulnerability is considered to be the degree to which social conditions affect a community’s ability to anticipate, manage, and recover from the effects of a disaster we used the prevalent definition of social vulnerability (Flanagan et al., 2011). In sociology, social vulnerability, referred to as structural health vulnerability, denotes the “increased propensity to incur health risks directly related to social inequalities stemming from the interaction between structural and epistemic injustice that affect an individual or a social group” (Chung, 2021). It is the difficulty or impossibility to control health risks that makes individuals or social groups more vulnerable than those, incurring the same health risks but who have the possibility and opportunity to seek shelter from risk exposure (DREES, 2020; Eilstein et al., 2015). Social disparities result in disparities in susceptibility, in exposure, and in access to and support received from the health system that vary by social group.
|
|||||||||||||||||||||||||||||||||||||||||||||||||||||||||||||||||
|
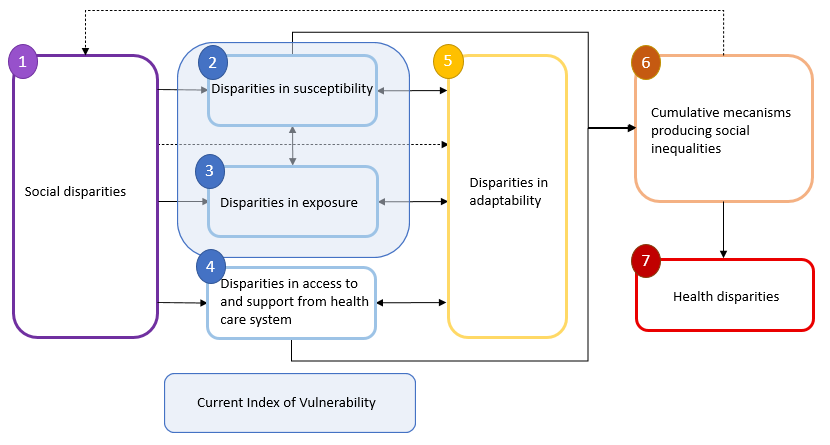
The conceptual framework of social vulnerability (Figure 1) starts with social disparities qui materialize in varying biological susceptibility, exposure as well as access to and support from health care systems. These mechanisms are in a dynamic relationship with a group’s adaptive capacity which, in a looping system, affect susceptibility, exposure and access to and support from health care systems. The accumulation of these different disparities results in social inequalities of health that we can observe at the population level. In more detail,
1) Social vulnerability stems from disparities in social situations. They refer to conditions or events that may lead to social distress (e.g., discrimination), economic distress (e.g., low income), or dependency (e.g., essential workers who are forced to continue working in a high-risk environment). All these situations can lead to an increased risk of exposure to a virus or an increase in susceptibility to risk factors. 2) to 4) Social disparities which are often intangible, create disparities between population groups in relation to 2) susceptibility, 3) exposure, and 4) access to and support from the health system. Social groups thus experience varying levels of susceptibility and exposure as well as less access to and support from the health system. Susceptibility refers to the overall likelihood of contracting a disease depending on the level of exposure and biological characteristics. The more susceptible an individual, or population, is to a specific exposure, the more likely it is that their health will be affected. Susceptibility also varies over time. The level of susceptibility to exposure can be high at one time but low at other moments. Exposure refers to the nature and level of risk factor(s) to which an individual or population may be exposed in their living or working environment. A certain level of exposure exists for everyone. The level varies over time. Adaptability is the ability to exercise control over risks by a population or an individual and, as such, links susceptibility and vulnerability. Indeed, a population and an individual can increase their exposure or their susceptibility and thus put themselves at an increased risk. They may also try to decrease their exposure and susceptibility to reduce the risk to a lower level. These behaviors therefore make it possible to adapt effectively to an increased risk situation. 5) While it is often possible to control risks, not all social groups have the same leeway in their ability to adapt to risks, which influences their risk of being affected by a disease. Components 2) to 5) are in a dynamic relationship. Exposure is converted into vulnerability (risk) by susceptibility. Adaptability, which is sensitive to vulnerability, influences both the level of exposure, by allowing preventive actions to be applied, and the susceptibility of individuals or populations. 6) Components 2) to 5) can cumulate over time and within social groups. They can also interact and multiply social inequalities. 7) Finally, the combined effect of social disparities, disparities in susceptibility, exposure and access to and support from the health care system combined with disparities in adaptability can result in health inequalities.
|
|
Blumenshine (2008) developed a conceptual framework sketching out possible sources of disparities during an influenza pandemic. We slightly adapted his figure to illustrate mechanisms that link social inequalities to health disparities associated with infectious diseases (Figure 1).
Figure 1 – Mechanisms linking social disparities to disparities in health (adapted from DREES 2020, Eilstein et al. 2015 and Public Health England Transmission Group, 2020
|
|||||||||||||||||||||||||||||||||||||||||||||||||||||||||||||||
Composition of the CVIQ |
|
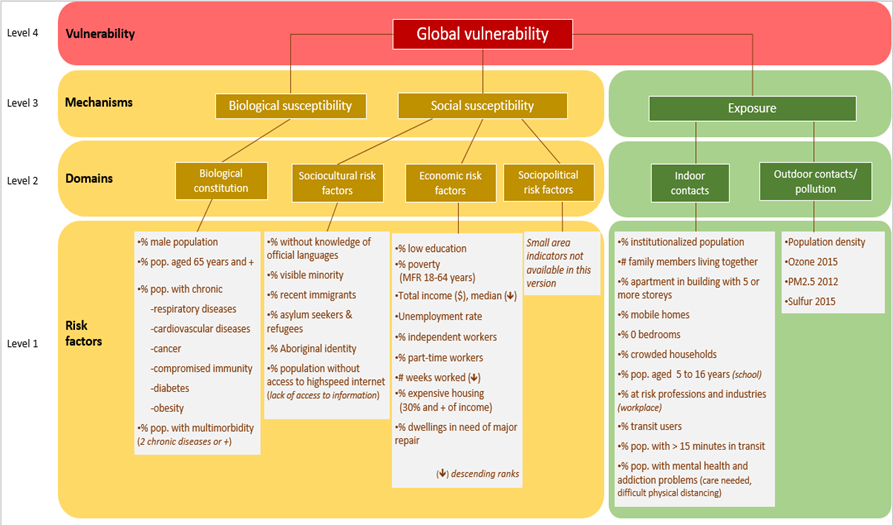
The CVIQ has four levels ranging from the most detailed to the most aggregated level (Figure 2): Level 1 - Individual risk factors for infectious diseases as gathered from the scientific literature. Level 2 – 6 risk domains, grouping risk factors thematically: a) Biological susceptibility domain: physiological, pathological, and genetic risk factors b) Sociocultural domain c) Economic domain d) Sociopolitical domain: not included as no indicators were available. e) Indoor contacts domain: specific population characteristics act as proxy variables for potentially increased exposure to infection through indoor contacts with infected persons. f) Outdoor contacts and air pollution domain: population density is used as a proxy for potentially increased outdoor exposure to infection. Three measures of air pollution are included as some studies link air pollution to increased susceptibility to infection. Measures of distance to green spaces and leisure facilities are planned to be integrated in a later version as they attract visitors, increasing temporarily local population density thus increasing the risk of outdoor infection. Level 3 - Two of the three mechanisms identified in the conceptual model can be distinguished: biological and social susceptibility to infection and exposure to infected persons. These mechanisms summarize the underlying domains for a more succinct measure of vulnerability. Level 4 - The global measure of vulnerability summarizes all risk factors and domains.
|
|||||||||||||||||||||||||||||||||||||||||||||||||||||||||||||||
Indicators and data sourcesPredisposing biological risk factors such as male sex, advanced age, and living with a chronic disease have been found to increase the risk of adverse outcomes from COVID-19 infection (Ge et al., 2021; Pijls et al., 2021). Social factors such as unemployment, low educational attainment, residential segregation, and ethnic composition were positively associated with COVID-19 mortality (Paul et al., 2021). Indoor exposure to SARS-CoV-2 related to overcrowding increased risk of mortality independently from poverty (Kamis et al., 2021). Population density and indoor air quality in living and workplace settings are all linked with the likelihood of exposure to SARS-CoV-2 (Weaver et al., 2022). Furthermore, physical proximity during public transportation and at the workplace were found to increase risk of COVID-19 infection (Ellingjord-Dale et al., 2022; Gaffney et al., 2023). Ethnic minority groups and individuals with low socioeconomic position may lack access to information, networks and resources teaching them how to protect themselves from infection (Goldsmith et al., 2022). Furthermore, neighbourhoods are often culturally and socioeconomically patterned sharing exposures related to housing type, transportation and green spaces. Long-term exposure to air pollution was also identified as a risk factor (Wu et al., 2020). Finally, communities with limited internet access had up to 5 times higher mortality rates (Lin et al., 2022). Blaser et al. (2023) put the ISVQ to the test and confirmed the associations observed by other studies. We identified risk factors used in other social vulnerability indices and reviewed their relevance related to COVID-19 morbidity and mortality in the literature (see documentation). We also consulted systematic reviews of risk factors for COVID-19 infection, morbidity and mortality (Albitar et al., 2020; Booth et al., 2021; Dessie & Zewotir, 2021; Hashim et al., 2020; Li et al., 2021; Mhango et al., 2020; Noor & Islam, 2020; Parohan et al., 2020; Zhang et al., 2023). While a few variables present some collinearity, accumulation of risk factors linked to socioeconomic status and sociocultural groups is well known to increase morbidity and mortality (Calderón-Larrañaga et al., 2020).We matched the retained risk factors to variables available in Quebec at the dissemination area (DA) level which is the smallest geographic scale for which Statistics Canada publishes aggregated population data. In total, the CVIQ covers 13,182 DA with a nonzero population, covering 97% of Quebec’s population. We bolstered the index with additional indicators such as comorbidities, internet access and air quality. DomainsThe CVIQ, the SVI and the CCVI are subdivided into domains (‘themes’) of vulnerability. The SVI has four domains including socioeconomic status (income, poverty, employment, education), household composition and disability (age, single parenting, disability), minority status and language (race, ethnicity, English language proficiency), and housing and transportation (housing structure, crowding, vehicle access). The more recently developed CCVI has a total of seven themes: three themes cover the social vulnerability domain. Socioeconomic status, minority status and language group the same indicators as the SVI. The household composition and disability domain was merged with the housing type and transportation domain. In addition, the CCVI has four themes in the health vulnerability domain: epidemiological factors, factors related to the healthcare system, high risk environments and population density. The CVIQ is divided into five domains following the susceptibility and exposure model outline by Blumenshine (2008). Epidemiological factors are captured in the biological susceptibility domain. We distinguish sociocultural and socioeconomic characteristics in the social vulnerability domain, analogous to the socioeconomic status and the minority status and language domains from the SVI. Our exposure domains are divided into a high-risk environment covering indoor exposure and outdoor exposure and air pollution separately. High risk environments refer to living or work settings that place sub-groups of the population at high risk of contracting the virus. During the COVID-19 epidemic these notably included nursing home and assisted living residents, prisoners, and workers in high-risk industries such as food processing, manufacturing, and transportation. Based on literature documenting the increased risk of mortality linked to air pollution, we added indicators to the outdoor exposure domain where we capture population density. Thus, the CVIQ crosses five domains: 1) biological susceptibility (9 variables); 2) sociocultural characteristics (6 variables); 3) socioeconomic characteristics (9 variables); 4) exposure to indoor contacts (11 variables); and 5) exposure to outdoor contacts and air pollution (4 variables) (Table 1). The index covers the main categories identified in a systematic review of social vulnerability associated with the COVID-19 pandemic (Fallah-Aliabadi et al., 2022, tbl. 2).
|
|
*all indicators available at the census dissemination area Table 1 : Risk factors for severe COVID-19 infection grouped by domain of susceptibility
|
|||||||||||||||||||||||||||||||||||||||||||||||||||||||||||||||
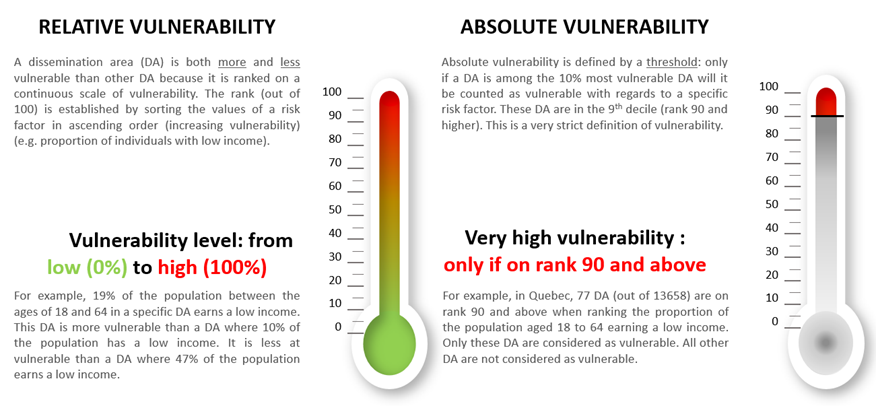
Absolute and relative vulnerabilityThe CVIQ is constructed with 39 risk factors for infection with the Covid-19 virus. All dissemination areas are vulnerable to some extent, more so for some risk factors, less so for others. When only dissemination areas in which one of the risk factors exceeds a certain threshold are considered to be vulnerable, we adopt a dichotomous approach. This view of vulnerability implies that a dissemination area is either vulnerable or it is not. This is an absolute measure because a predefined threshold is used rather than a comparison with other dissemination areas. Another point of view is to look at where the level of vulnerability of a dissemination area stands relative to other dissemination areas for each of the 39 risk factors. This is a relative measure. · Absolute vulnerability is defined by a threshold and designates only the dissemination areas in decile 10 as vulnerable. · Relative vulnerability assigns a higher or lower level of vulnerability to all dissemination areas. The advantage of having two measures is that you can choose a very restrictive definition of vulnerability or a finely graduated one. The choice of which measure to use relates to the purpose of its use. |
|
Figure 3 : Defining relative and absolute vulnerability
|
|||||||||||||||||||||||||||||||||||||||||||||||||||||||||||||||
Transformation of indicatorsWe followed the method of the CCVI (Smittenaar et al., 2021) and the SVI (CDC Agency for Toxic Substances and Disease Registry (ATSDR), 2021). For each indicator, we calculated the proportion of the population at risk within a dissemination area. For example, we calculated the unemployment rate as the proportion of persons available to work within the labour force. For income, we used the median within the dissemination area. We used frequency counts for the number of weeks worked during the year and number of family members living together. For population density, we used the number of residents per square kilometer (Statistics Canada, 2006). For air pollution, we used the mean annual concentration of ozone, sulfur, and fine particulate matter (CANUE, 2022). NO2 was not available at the DA level. We then ranked DA from highest to lowest for each risk factor, except for income and number of weeks worked, which we ranked from lowest to highest. This ranking was transformed into percentiles ranging from 1 to 100. Some percentiles hold several DA while others are empty.
Relative vulnerability: construction of domainsWe summed the percentile ranks of risk factors within a given domain and repeated the ranking process to obtain an overall percentile rank for the domains. We proceeded in the same manner for each of the five domains. Relative vulnerability: construction of mechanismsWe repeated the process of calculating percentiles for each of the three mechanisms in the same way as we constructed the domains: we summed the percentiles of the domain value for each DA and ranked DA from highest to lowest. We then transformed the ranking into percentiles. Relative vulnerability: construction of the global vulnerability measureFor the global measure, we proceeded in the same was as before by summing the percentile measures of each mechanism for every DA. We then ranked DA from highest to lowest. We then transformed the ranking into percentiles. Absolute vulnerability: construction of domainsFollowing the SVI, we classified DA on an absolute scale using the 90th percentile as a threshold in which areas below (or above) are considered equally vulnerable (threshold measure of vulnerability). For each DA, we dichotomized percentile rankings as high (≥ 90th percentile) versus low (< 90th percentile) vulnerability for each indicator. We then computed the proportion of indicators in each DA classified as high vulnerability in each domain. Absolute vulnerability: construction of mechanismsUsing the dichotomized version of the indicators, we computed the proportion of indicators included in the mechanism in each DA considered as highly vulnerable. Absolute vulnerability: construction of the global vulnerability measureFor the global measure, we computed the proportion of all dichotomized indicators for each DA which had a ranking of 90th percentile and above. |
|
Categorisation of vulnerability levels: from continuous to 5 levelsWe produced absolute and relative index measures for all domains, mechanisms and global vulnerability as both a continuous percentile rank and a 5-level category variable to facilitate handling in graphs, tables, and maps. Instead of grouping DA into quintiles which ignore natural clustering, we used the Fastclus procedure in SAS to group the percentile ranks for each domain into five categories of vulnerability where 1 indicates the lowest and 5 the highest level of vulnerability. This procedure uses the natural breaks algorithm which creates natural clusters within the data. The categories are created by grouping DA with similar values, while maximizing the difference between DA in different clusters (Jenks, 1977; SAS Institute Inc., 2000). Tables 4 and 5 in the appendix show the percentile breaks for each vulnerability measure (see documentation).
Note We did not calculate vulnerability for DA with three or more missing indicators (n=422) nor those with zero population counts (n=16). We excluded DA in the two northern regions of Nunavik and the Cree Territory of James Bay (n=38) mainly due to missing data (24% of DA) and lack of indicator relevance in these considerably different living conditions. For example, buildings higher than 5 storeys don’t exist. |
|||||||||||||||||||||||||||||||||||||||||||||||||||||||||||||||
|
Comparisons at varying geographical levels Since social vulnerability is measured at small-area level, levels of vulnerability can be compared between regions. It is important to understand that vulnerability needs to be computed in the same way for DA to be compared. The ranking procedure includes DA either from the same metropolitan area, from the same sociosanitary region or from the entire province. This results in different versions of the vulnerability measure. Imagine a very vulnerable DA in a prosperous municipality. This same DA which is at the top of vulnerability compared to other DA in the same municipality may be in the middle of the ranking when DA from all over Quebec are compared because they may be more vulnerable than the most vulnerable DA in a prosperous metropolitan area. To improve precision of comparisons, six versions of the CVIQ were developed, each allowing comparison with specific regions, and for relative and absolute vulnerability.
Download the CVIQ
Table 2 : Different versions of the CVIQ available for download
|
|
It is important to choose the appropriate version of the CVIQ by asking yourself two questions:
National, regional or local version? · If you are looking to compare DAs within one of the four large municipalities, use the local version. Be aware that the local version will identify an AD as the most (or least vulnerable) within the four municipalities. This does not mean however that there is not an even more vulnerable DA elsewhere in Quebec or in another health region. · If you are comparing DAs within a single health region, use the regional version. · Finally, if you are working with DAs from all over Quebec, use the national version.
Relative or absolute version? · The absolute version of the CVIQ is based on a very strict definition of vulnerability. It applies only to risk factors (level 1), not domains (level 2) or mechanisms (level 3). The DA must be in the top 10% of the most vulnerable DAs to be considered vulnerable. All other DAs are considered non-vulnerable. This measure is ideal for identifying pockets of high social vulnerability. · The relative version of the CVIQ also applies to the risk factors on which the index is based. It includes all vulnerability levels. It is therefore very gradual and better suited to determining a critical degree of vulnerability by the researcher and to considering the entire spectrum.
National version: includes all DAs in the province of Quebec in the same ranking. Regional version: vulnerability was calculated retaining DAs for each sociosanitary region separately. Local version: DAs from each of four major municipalities (Montréal, Québec, Laval, Gatineau) were ranked separately.
The data dictionary is included in the documentation.
|
|||||||||||||||||||||||||||||||||||||||||||||||||||||||||||||||
Mapping of the SVIQIl is possible to show the different vulnerability measures on a zoomable map of Québec on which the domain, the regional comparison and the absolute or relative vulnerability version can be selected which allows a customized view of specific geographic areas.
Quick instructions for mapping 1. Go to maps website: https://cartes.inspq.qc.ca/iss/ 2. Click on the 'burger' at the top left 2. 3. Click on the star (Contexts) 3. 4. Click on one of the versions of the CVIQ (national, regional or local). 5. Choose one of the measures (absolute or relative, a specific domain or mechanism, or the global measure) by clicking on the eye (Map-Layers). 6. The tab on the right in this menu (Map-Legend) allows you to view the legend by scrolling down to the selected measurement. 7. Move or zoom the map to the region you want to view. 8. By clicking on a DA the map, a window displaying the values of the risk factors as well as the detailed and grouped vulnerability measure appears.
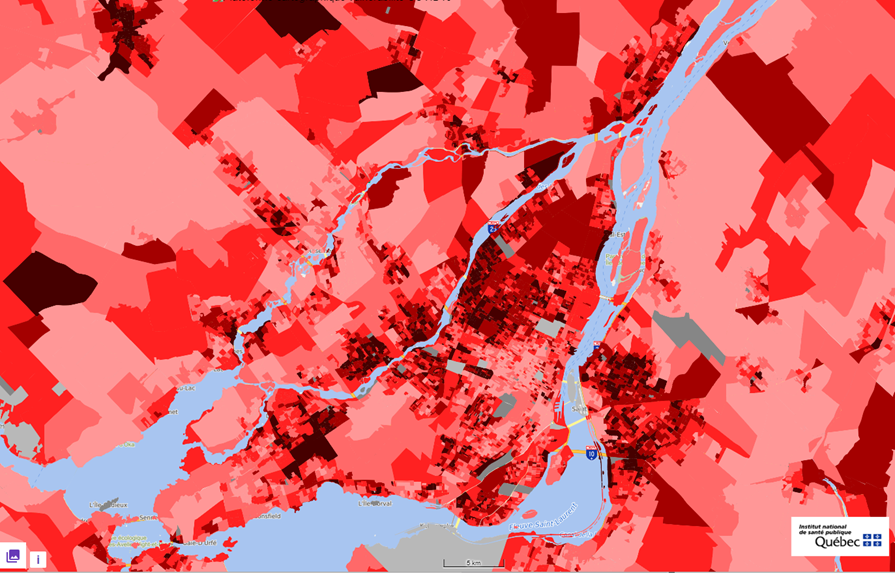
The map (Figure 4) shows the Islands of Montreal and Laval as well as parts of the North and South Shore. Poorer neighbourhoods and those with a high proportion of immigrant population appear clearly in Montreal’s eastern and southern parts. The map shows the local version of the index with 5 clusters of relative vulnerability levels ranging from light red – very low vulnerability to dark red – very high vulnerability.
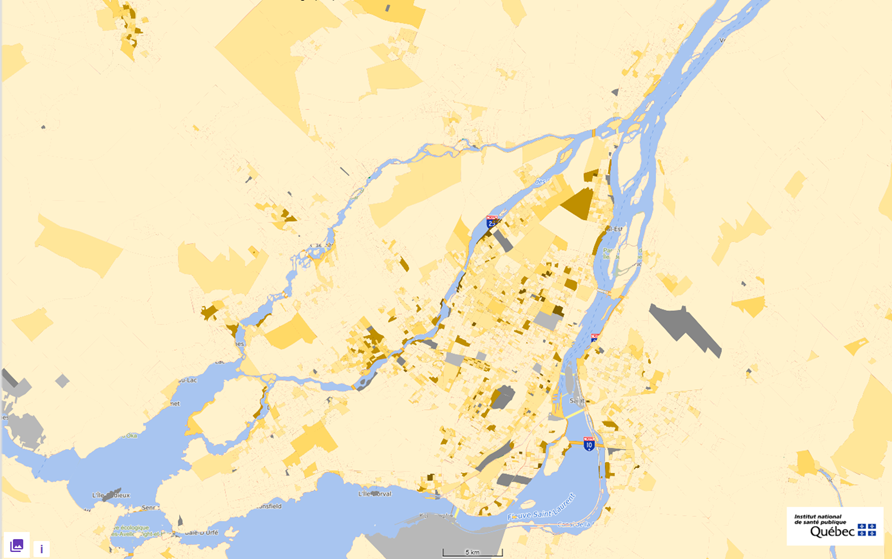
The map of the Islands of Montreal and Laval as well as parts of the North and South Shore (Figure 5) shows only a few spots of neighbourhoods with very high absolute vulnerability. These are situated within areas with higher relative vulnerability. The index thus identifies small areas where focused interventions such as distribution of face masks or a local mobile vaccination station could take place. The map shows the local version of the index with 5 clusters of absolute vulnerability levels ranging from light yellow – very low vulnerability to brown – very high vulnerability. |
|
Figure 4 : Levels of global relative vulnerability at DA level
Figure 5 : Levels of global absolute vulnerability at DA level
|
|||||||||||||||||||||||||||||||||||||||||||||||||||||||||||||||
Data sources· CANUE. (2022). Calculated SO2, ozone and PM2.5 metrics indexed to DMTI Spatial Inc. postal codes were provided by Canadian Urban Environmental Health Research Consortium. Specific references: [1] Environment and Climate Change Canada, 2017. Air Quality Research Division, Toronto, Canada. Data files: OMI_Ground-Level_SO2_NA_2005.nc to OMI_Ground-Level_SO2_NA_2015.nc inclusive, generated 2017-07-05. [2] McLinden, C. A., Fioletov, V., Boersma, et al. Improved satellite retrievals of NO2 and SO2 over the Canadian oil sands and comparisons with surface measurements, Atmos. Chem. Phys., 14, 3637-3656, doi:10.5194/acp-14-3637-2014, 2014. [3] Kharol, S. K., McLinden, C. A., Sioris, et al.: OMI satellite observations of decadal changes in ground-level sulfur dioxide over North America, Atmos. Chem. Phys., 17, 5921-5929, doi:10.5194/acp-17-5921-2017, 2017. [4] Environment and Climate Change Canada, 2017. Air Quality Research Division, Toronto, Canada. Data files: CHRONOS_Ground-Level_O3_NA_2002.nc to CHRONOS_Ground-Level_O3_NA_2009.nc inclusive, generated July 2017. [5] Environment and Climate Change Canada, 2017. Air Quality Research Division, Toronto, Canada. Data files: GEMMACH_Ground-Level_O3_NA_2010.nc to GEMMACH_Ground-Level_O3_NA_2015.nc inclusive, generated July 2017. [6] Robichaud A, Ménard R. Multi-year objective analyses of warm season ground-level ozone and PM 2.5 over North America using real-time observations and Canadian operational air quality models. Atmospheric Chemistry and Physics. 2014 Feb 17;14(4):1769-800. [7] Robichaud A, Ménard R, Zaïtseva Y, Anselmo D. Multi-pollutant surface objective analyses and mapping of air quality health index over North America. Air Quality, Atmosphere [8] Hammer, M. S.; van Donkelaar, A.; Li, C.; Lyapustin, A.; et al. Global Estimates and Long-Term Trends of Fine Particulate Matter Concentrations (1998-2018)., Environ. Sci. Technol, doi: 10.1021/acs.est.0c01764, 2020. [9] CanMap Postal Code Suite (various years). [computer files] Markham, ON : DMTI Spatial Inc. · Statistics Canada. (2016). Census of the population. · Blais, C., Jean, S., Sirois, C., Rochette, L., Plante, C., Larocque, I., Doucet, M., Ruel, G., Simard, M., Gamache, P., Hamel, D., St-Laurent, D., & Emond, V. (2014). Quebec integrated chronic disease surveillance system (QICDSS), an innovative approach. Chronic Diseases and Injuries in Canada, 34(4), 226–235. · ISED. (2020). National broadband data 2020. Innovation, Science and Economic Development Canada.· ISED. (2020). Pseudo-household demographic distribution. Innovation, Science and Economic Development Canada.Other COVID-19 vulnerability indicesSimilar vulnerability indices were developed for British Columbia, the city of Toronto, the United States and the United Kingdom. Ø COVID-19 Risks in British Columbia’s Neighbourhoods Ø COVID-19 Neighbourhood Vulnerability Index Ø COVID-19 Pandemic Vulnerability Index Ø COVID-19 Community Vulnerability Index Ø British Red Cross COVID-19 Vulnerability Index
ReferencesAlbitar, O., Ballouze, R., Ooi, J. P., & Sheikh Ghadzi, S. M. (2020). Risk factors for mortality among COVID-19 patients. Diabetes Research and Clinical Practice, 166, 108293. https://doi.org/10.1016/j.diabres.2020.108293 Blaser, C. (2021). Indice québécois de vulnérabilité sociale dans un contexte de COVID-19. https://vulnerabilitecovid.cbcr.me/ Blaser, C., Gautier, L., Brousseau, É., Auger, N., & Frohlich, K. L. (2023). Inequality in COVID-19 mortality in Quebec associated with neighbourhood-level vulnerability domains. Canadian Journal of Public Health / Revue Canadienne de Santé Publique. https://doi.org/10.17269/s41997-023-00829-7 Blumenshine, P., Reingold, A., Egerter, S., Mockenhaupt, R., Braveman, P., & Marks, J. (2008). Pandemic Influenza Planning in the United States from a Health Disparities Perspective. Emerging Infectious Diseases, 14(5), 709–715. https://doi.org/10.3201/eid1405.071301 Booth, A., Reed, A. B., Ponzo, S., Yassaee, A., Aral, M., Plans, D., Labrique, A., & Mohan, D. (2021). Population risk factors for severe disease and mortality in COVID-19: A global systematic review and meta-analysis. PLOS ONE, 16(3), e0247461. https://doi.org/10.1371/journal.pone.0247461 Calderón-Larrañaga, A., Dekhtyar, S., Vetrano, D. L., Bellander, T., & Fratiglioni, L. (2020). COVID-19: Risk accumulation among biologically and socially vulnerable older populations. Ageing Research Reviews, 63, 101149. https://doi.org/10.1016/j.arr.2020.101149 CDC. (2021). Social Vulnerability Index (SVI). https://www.atsdr.cdc.gov/placeandhealth/svi/fact_sheet/fact_ sheet.html. CDC Agency for Toxic Substances and Disease Registry (ATSDR). (2020, September 15). CDC Social Vulnerability Index (SVI) Documentation 2018. https://www.atsdr.cdc.gov/placeandhealth/svi/documentation/SVI_documentation_2018.html Chung, R. (2021). Structural health vulnerability: Health inequalities, structural and epistemic injustice. Journal of Social Philosophy, n/a(n/a). https://doi.org/10.1111/josp.12393 Crooks, V. (2020). COVID-19 Risks in British Columbia’s Neighbourhoods. Mapping Risk & Vulnerability Across the Province. https://storymaps.arcgis.com/stories/b390728f6d6f43c8bfcddf0b9e4dbbc4 Dessie, Z. G., & Zewotir, T. (2021). Mortality-related risk factors of COVID-19: A systematic review and meta-analysis of 42 studies and 423,117 patients. BMC Infectious Diseases, 21(1), 855. https://doi.org/10.1186/s12879-021-06536-3 DREES. (2020). Les inégalités sociales face à l’épidémie de Covid-19 (62; Les Dossiers de La DREES). Direction de la recherche, des études, de l’évaluation et des statistiques. drees.solidarités-sante.gouv.fr Eilstein, D., Gorza, M., Perrey, C., Vernay, M., Marchand, J.-L., Colleville, A.-C., & Pascal, M. (2015). Vulnérabilité face à la maladie. La place de l’Institut de veille sanitaire. Ellingjord-Dale, M., Kalleberg, K. T., Istre, M. S., Nygaard, A. B., Brunvoll, S. H., Eggesbø, L. M., Dahl, J. A., Kjetland, E. F., Ursin, G., & Søraas, A. (2022). The use of public transport and contraction of SARS-CoV-2 in a large prospective cohort in Norway. BMC Infectious Diseases, 22(1), 252. https://doi.org/10.1186/s12879-022-07233-5 Fallah-Aliabadi, S., Fatemi, F., Heydari, A., Khajehaminian, M. R., Lotfi, M. H., Mirzaei, M., & Sarsangi, A. (2022). Social vulnerability indicators in pandemics focusing on COVID-19: A systematic literature review. Public Health Nursing, 39(5), 1142–1155. Flanagan, B. E., Gregory, E. W., Hallisey, E. J., Heitgerd, J. L., & Lewis, B. (2011). A Social Vulnerability Index for Disaster Management. Journal of Homeland Security and Emergency Management, 8(1). https://www.atsdr.cdc.gov/placeandhealth/svi/img/pdf/Flanagan_2011_SVIforDisasterManagement-508.pdf Flanagan, B. E., Hallisey, E. J., Adams, E., & Lavery, A. (2018). Measuring Community Vulnerability to Natural and Anthropogenic Hazards: The Centers for Disease Control and Prevention’s Social Vulnerability Index. Journal of Environmental Health, 80(10), 34–36. Gaffney, A., Himmelstein, D. U., McCormick, D., & Woolhandler, S. (2023). COVID-19 Risk by Workers’ Occupation and Industry in the United States, 2020‒2021. American Journal of Public Health, 113(6), 647–656. Ge, E., Li, Y., Wu, S., Candido, E., & Wei, X. (2021). Association of pre-existing comorbidities with mortality and disease severity among 167,500 individuals with COVID-19 in Canada: A population-based cohort study. PloS One, 16(10), e0258154. https://doi.org/10.1371/journal.pone.0258154 Goldsmith, L. P., Rowland-Pomp, M., Hanson, K., Deal, A., Crawshaw, A. F., Hayward, S. E., Knights, F., Carter, J., Ahmad, A., Razai, M., Vandrevala, T., & Hargreaves, S. (2022). Use of social media platforms by migrant and ethnic minority populations during the COVID-19 pandemic: A systematic review. BMJ Open, 12(11), e061896. https://doi.org/10.1136/bmjopen-2022-061896 Hashim, M. J., Alsuwaidi, A. R., & Khan, G. (2020). Population Risk Factors for COVID-19 Mortality in 93 Countries. Journal of Epidemiology and Global Health, 10(3), 204–208. https://doi.org/10.2991/jegh.k.200721.001 Jenks, G. F. (1977). Optimal data classification for choropleth maps (2; Occasional Paper, p. 50). University of Kansas. Department of Geography. Kamis, C., Stolte, A., West, J. S., Fishman, S. H., Brown, T., Brown, T., & Farmer, H. R. (2021). Overcrowding and COVID-19 mortality across U.S. counties: Are disparities growing over time? SSM - Population Health, 15, 100845. https://doi.org/10.1016/j.ssmph.2021.100845 Khan, S. S., McCabe, M. E., Krefman, A. E., Petito, L. C., Yang, X., Kershaw, K. N., Pool, L., & Allen, N. B. (2020). A County-Level Susceptibility Index and Coronavirus Disease 2019 Mortality in the United States: A Socioecological Study (p. 2020.07.04.20146084). medRxiv. https://doi.org/10.1101/2020.07.04.20146084 Li, J., Huang, D. Q., Zou, B., Yang, H., Hui, W. Z., Rui, F., Yee, N. T. S., Liu, C., Nerurkar, S. N., Kai, J. C. Y., Teng, M. L. P., Li, X., Zeng, H., Borghi, J. A., Henry, L., Cheung, R., & Nguyen, M. H. (2021). Epidemiology of COVID-19: A systematic review and meta-analysis of clinical characteristics, risk factors, and outcomes. Journal of Medical Virology, 93(3), 1449–1458. https://doi.org/10.1002/jmv.26424 Lin, Q., Paykin, S., Halpern, D., Martinez-Cardoso, A., & Kolak, M. (2022). Assessment of Structural Barriers and Racial Group Disparities of COVID-19 Mortality with Spatial Analysis. JAMA Network Open, 5(3). Scopus. https://doi.org/10.1001/jamanetworkopen.2022.0984 Marvel, S. W., House, J. S., Wheeler, M., Song, K., Zhou, Y.-H., Wright, F. A., Chiu, W. A., Rusyn, I., Motsinger, -Reif Alison, & Reif, D. M. (2021). The COVID-19 Pandemic Vulnerability Index (PVI) Dashboard: Monitoring County-Level Vulnerability Using Visualization, Statistical Modeling, and Machine Learning. Environmental Health Perspectives, 129(1), 017701. https://doi.org/10.1289/EHP8690 Mhango, M., Dzobo, M., Chitungo, I., & Dzinamarira, T. (2020). COVID-19 Risk Factors Among Health Workers: A Rapid Review. Safety and Health at Work, 11(3), 262–265. https://doi.org/10.1016/j.shaw.2020.06.001 Noor, F. M., & Islam, Md. M. (2020). Prevalence and Associated Risk Factors of Mortality Among COVID-19 Patients: A Meta-Analysis. Journal of Community Health, 45(6), 1270–1282. https://doi.org/10.1007/s10900-020-00920-x Parohan, M., Yaghoubi, S., Seraji, A., Javanbakht, M. H., Sarraf, P., & Djalali, M. (2020). Risk factors for mortality in patients with Coronavirus disease 2019 (COVID-19) infection: A systematic review and meta-analysis of observational studies. The Aging Male, 23(5), 1416–1424. https://doi.org/10.1080/13685538.2020.1774748 Paul, R., Adeyemi, O., Ghosh, S., Pokhrel, K., & Arif, A. A. (2021). Dynamics of Covid-19 mortality and social determinants of health: A spatiotemporal analysis of exceedance probabilities. Annals of Epidemiology, 62, 51–58. https://doi.org/10.1016/j.annepidem.2021.05.006 Pijls, B. G., Jolani, S., Atherley, A., Derckx, R. T., Dijkstra, J. I. R., Franssen, G. H. L., Hendriks, S., Richters, A., Venemans-Jellema, A., Zalpuri, S., & Zeegers, M. P. (2021). Demographic risk factors for COVID-19 infection, severity, ICU admission and death: A meta-analysis of 59 studies. BMJ Open, 11(1), e044640. Public Health England Transmission Group. (2020). Factors contributing to risk of SARS-CoV2 transmission in various settings. SAS Institute Inc. (2000). SAS Online Doc, Version 8. SAS Institute Inc. Smittenaar, P., Stewart, N., Sutermaster, S., Coome, L., Dibner-Dunlap, A., Jain, M., Caplan, Y., Campigotto, C., & Sgaier, S. K. (2021). A COVID-19 Community Vulnerability Index to drive precision policy in the US. https://doi.org/10.1101/2021.05.19.21257455 Surgo Ventures. (2020). Bringing Greater Precision to the COVID-19 Response. COVID-19 Community Vulnerability Index. https://precisionforcovid.org/ccvi Tipirneni, R., Schmidt, H., Lantz, P. M., & Karmakar, M. (2022). Associations of 4 Geographic Social Vulnerability Indices With US COVID-19 Incidence and Mortality. American Journal of Public Health, 112(11), 1584–1588. Scopus. https://doi.org/10.2105/AJPH.2022.307018 Weaver, A. K., Head, J. R., Gould, C. F., Carlton, E. J., & Remais, J. V. (2022). Environmental Factors Influencing COVID-19 Incidence and Severity. Annual Review of Public Health, 43(1), 271–291. Wolkin, A., Collier, S., House, J. S., Reif, D., Motsinger-Reif, A., Duca, L., & Sharpe, J. D. (2022). Comparison of National Vulnerability Indices Used by the Centers for Disease Control and Prevention for the COVID-19 Response. Public Health Reports, 137(4), 803–812. https://doi.org/10.1177/00333549221090262 Wu, Y., Jing, W., Liu, J., Ma, Q., Yuan, J., Wang, Y., Du, M., & Liu, M. (2020). Effects of temperature and humidity on the daily new cases and new deaths of COVID-19 in 166 countries. The Science of the Total Environment, 729, 139051. https://doi.org/10.1016/j.scitotenv.2020.139051 Yang, C., Datta, P., & Nguyen. (2020). reCOVer—COVID-19 Neighbourhood Vulnerability Index for Toronto. https://esricanada-ce.github.io/ecce-app-challenge-2020/QuaranTEAM/app/ Zhang, J., Dong, X., Liu, G., & Gao, Y. (2023). Risk and Protective Factors for COVID-19 Morbidity, Severity, and Mortality. Clinical Reviews in Allergy & Immunology, 64(1), 90–107. https://doi.org/10.1007/s12016-022-08921-5 |
|||||||||||||||||||||||||||||||||||||||||||||||||||||||||||||||||


©2023 Christine Blaser (christine.blaser@umontreal.ca)